Introduction
Welcome to the seventh and final article of our finance theory series, focused on investment. In the previous article, we delve into the market efficiency assumption and how it has divided the field of finance between rational and behavioral schools of thought. We've explored the nuances of this discussion and acknowledged that while short-term market inefficiencies do exist, there's a prevailing belief in at least semi-strong market efficiency over longer timeframes. Rational models, despite their imperfections, remain the best tools we can rely on as individual investors.
In this concluding article, we'll go over the key takeaways from the theories we've discussed and demonstrate how these insights can empower us to become better investors.
Key Takeaways
Throughout this series, we've navigated the evolving landscape of financial theory, gaining insight into how it shapes our understanding of financial markets. While acknowledging that unanswered questions persist, we can anticipate improved models to emerge in the future, bridging the gap between rational and behavioral perspectives. For now, let's focus on summarizing the key lessons from our journey, illustrated by the Nobel Prize-winning theories we've explored.

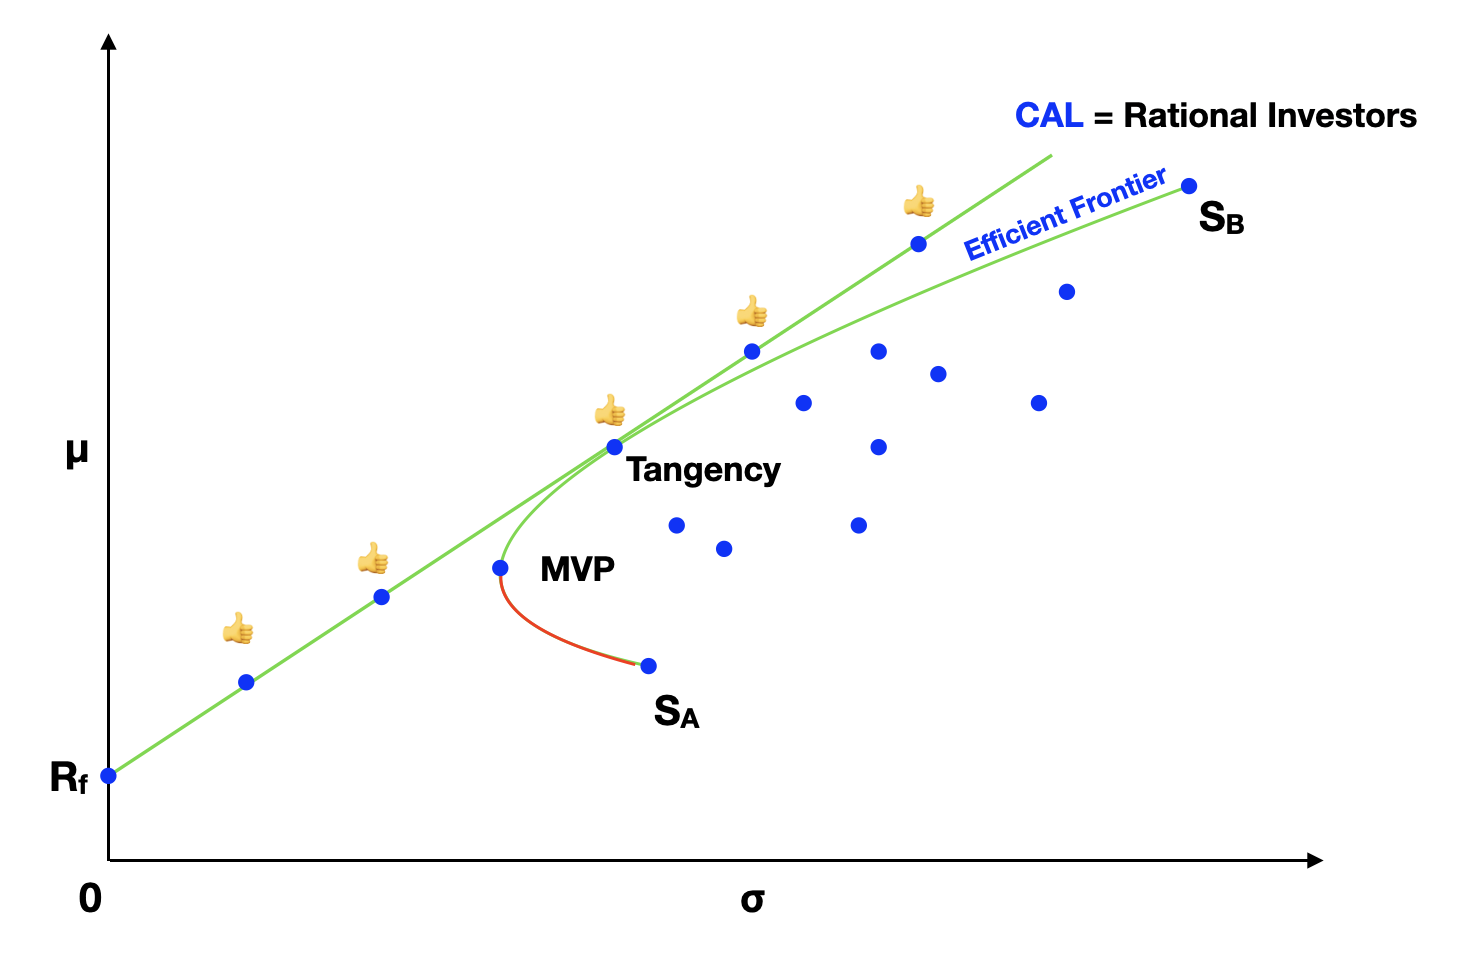
The Modern Portfolio Theory (MPT) graph, shows assets plotted by their expected return (y-axis) and standard deviation (x-axis). It depicts the Efficient Frontier and the Capital Allocation Line (CAL), which is formed by portfolios that mix the risk-free asset with the risky Tangency portfolio. Portfolios along the CAL are the most efficient, having the highest return-to-risk ratio (Sharpe ratio). They are the portfolios of choice for all rational investors.

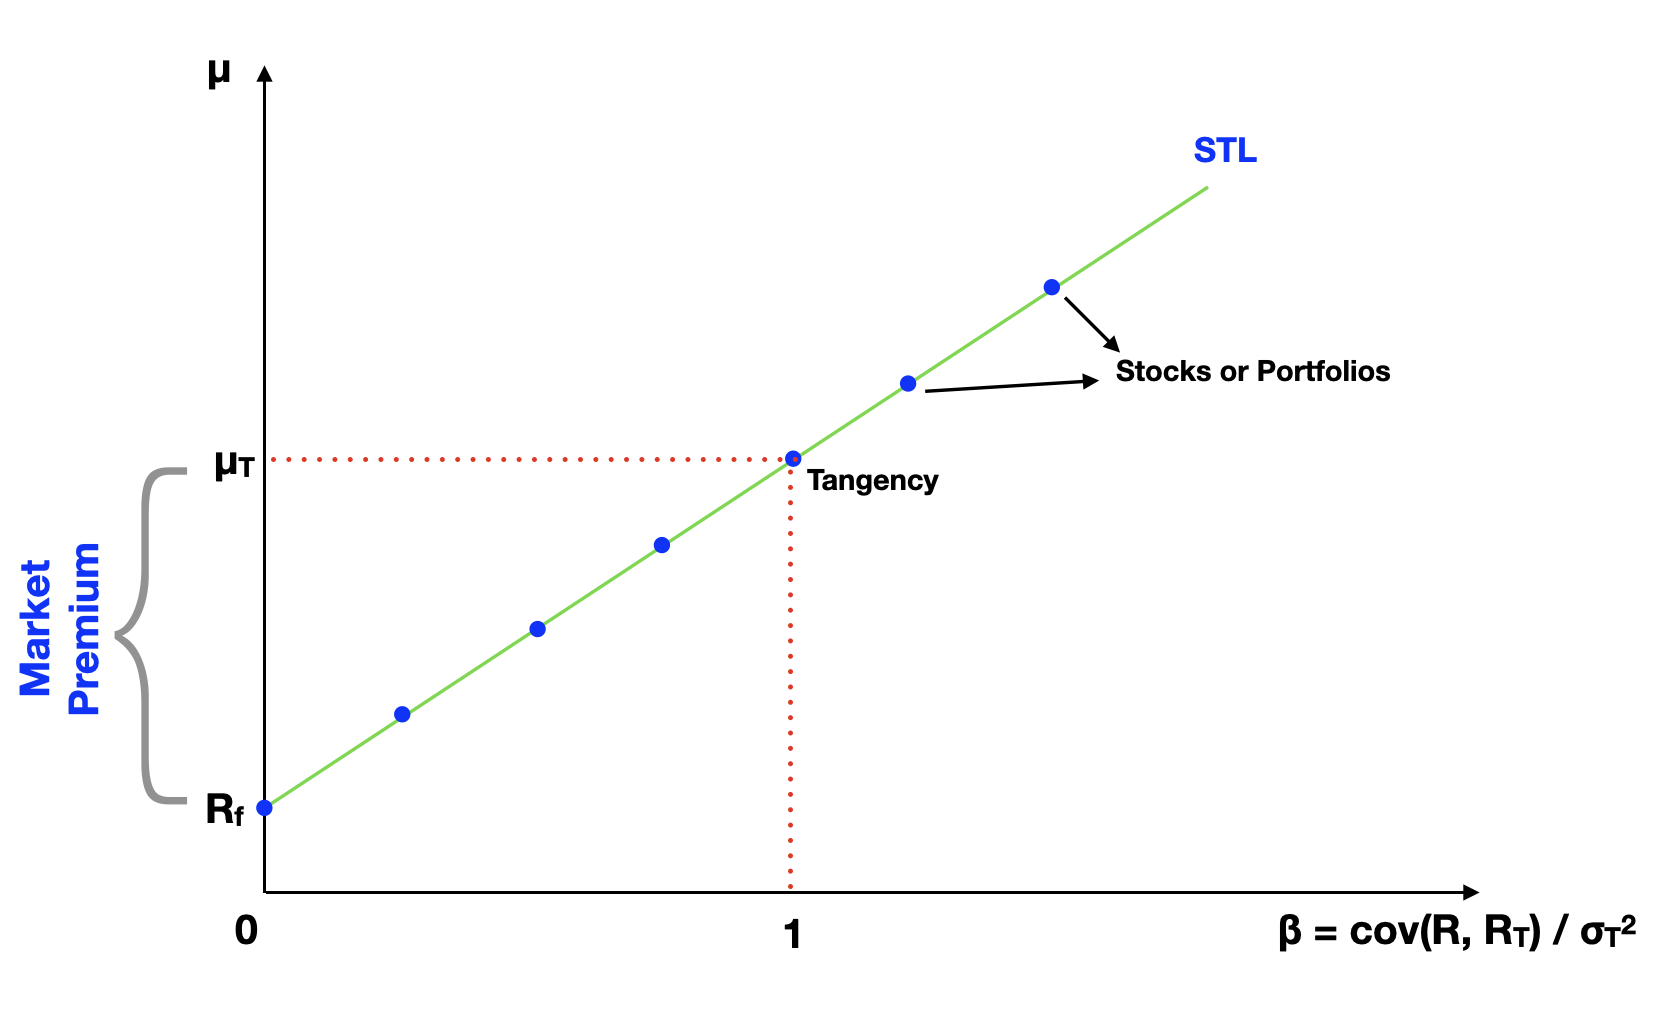
The Capital Asset Pricing Model (CAPM) graph, displays assets plotted by their expected return (y-axis) and beta (x-axis). As you remember, beta is a measure of systematic risk (market risk), the part of the asset volatility that cannot be diversified. According to the CAPM, correctly priced assets and portfolios in the market should line up on the Security Tangent Line (STL), with higher beta assets yielding progressively higher expected return.
Takeaway #1: Investment returns are related to their risk.
The next time a financial advisor touts the returns of a particular investment or fund, remember that risk is an integral part of the equation. Challenge them to provide a measure of risk alongside those returns. You can use it to calculate the return-to-risk ratio (Sharpe ratio), a vital metric indicating investment efficiency. As shown in the MPT graph, assets with similar expected returns may exhibit varying levels of risk.
For actively managed funds, you can also inquire about the fund's alpha, which should be computed after factoring in all fees. The alpha metric will tell whether the fund genuinely outperforms the market, according to the CAPM. Funds with a positive alpha, positioned above the STL, yield returns higher than the model predicts. Conversely, assets or portfolios with a zero or negative alpha may not offer adequate returns considering their risk.
Takeaway #2: Volatility is a measure of total risk, with diversifiable and undiversifiable parts.
Volatility has a diversifiable component, known as idiosyncratic risk, related to specific company or industry risk. And an undiversifiable component, called systematic risk, which relates to the overall economy or market risk. We can grasp this concept by looking at the MPT graph. It's possible to get rid of some of the volatility, but there's a limit. We cannot eliminate risk beyond (above) the Capital Allocation Line (CAL).
Takeaway #3: Adding assets to a portfolio eliminates idiosyncratic risk.
Diversification is a potent tool for risk management. By incorporating low-correlation assets into your portfolio, you can mitigate specific company and industry risks. Research suggests that portfolios with over 20 assets spanning diverse industries are close to fully diversified. To check a portfolio's level of diversification in percentage terms, examine the r-squared metric from the CAPM model. Diversification is one of the few free lunches in finance, so take advantage of it!
Takeaway #4: A return premium is paid only for bearing systematic risk.
This is an essential concept for a successful long-term investment strategy. There is no benefit in not diversifying your portfolio. You would just be taking more unnecessary risk, which you're not being rewarded for. Use the CAPM or another multi-factor models, such as the Fama-French, to estimate expected return for a specific level of systematic risk (beta or betas).
Takeaway #5: A value weighted portfolio of the whole market has the highest Sharpe ratio.
For rational investors, the Tangency portfolio, which is a value-weighted portfolio of the entire market, is the preferred choice. Hence, many experts recommend investing in market index funds. However, be cautious when selecting an index. Ensure the index is calculated as a value-weighted representation of the market. Also remember that the whole market is not entirely observable, and proxy indexes like the total US equity market may not encompass all asset classes in the economy.
Self-directed investors can consider using exchange-traded funds (ETFs) to fill gaps in their portfolios and employ mean-variance analysis to determine efficient portfolios and the Tangency portfolio. Factor tilting or smart beta strategies, using ETFs based on risk factors like size and value, can provide an additional edge. For example, you can split your assets into small and large stocks or value and growth stocks. And then tilt your allocation towards one or more of these factors.
Takeaway #6: Rational investors should invest in a mix of the risk-free asset and the Tangency portfolio.
All the portfolios on the Capital Allocation Line (CAL) are rational choices, having the highest return-to-risk ratio (Sharpe ratio). Once you the Tangency portfolio mix is calculated, you can calibrate the amount of risk by mixing the risk-free asset to your portfolio. Your best proxy for the risk-free asset is probably a short-term treasury bill, with volatility close to zero. The risk exposure is decreased by adding weight to the risk-free asset. The level of risk, and consequently the potential reward, can also be increased by adding more weight to the Tangency portfolio.
It's possible to go beyond the Tangency portfolio risk, up along the CAL. This leveraged position is made possible by borrowing at the risk-free rate and investing the extra money on the Tangency portfolio. In practice, the borrowing rate is a bit higher than the risk-free investing rate. The spread between the rates makes the CAL slope change (CAL line breaks) at the Tangency portfolio point.
Takeaway #7: Market inefficiencies are hard to exploit.
We've all seen how market bubbles can form and burst, fed by investors' greed and fears. Even though the market does shows signs of inefficiencies over certain time periods, making money off these inefficiencies is really hard. It is a zero-sum game, where someone has to lose for another person to win. There are a lot of institutional players with plenty of resources trying to play this game. Historically, nobody has proven to win this game consistently. Transaction costs on short-term trading can also erode some of the gains. Think twice before trading based on spotted inefficiency in the market. If you are a self-directed investor, you would probably be better off with a long-term investing strategy.
Time To Go
We've covered a lot on this seven-article series on investment. Our goal was a bit ambitious: to go over decades of financial research in a few articles. We focused on understanding the key principles and insights of important Nobel Prize winning theories, which I am confident can help us make better investment decisions. I hope you enjoyed the journey!
If you have comments or feedback about this article, please send us a note at feedback@bearnbull.com. Make sure to also visit BearNBull's website, where you can find more resources to make you a better investor.